A function that plots the localization data of one individual.
Arguments
- data
A dataframe with the tracking data. Can include multiple tags, but one tag is selected for plotting.
- tag
The four-digit tag number as character to plot. Defaults to plotting the first tag in
data.- fullname
If specified the plot will be saved in this path with this name (include extension). Defaults to NULL and plotting in a graphics window.
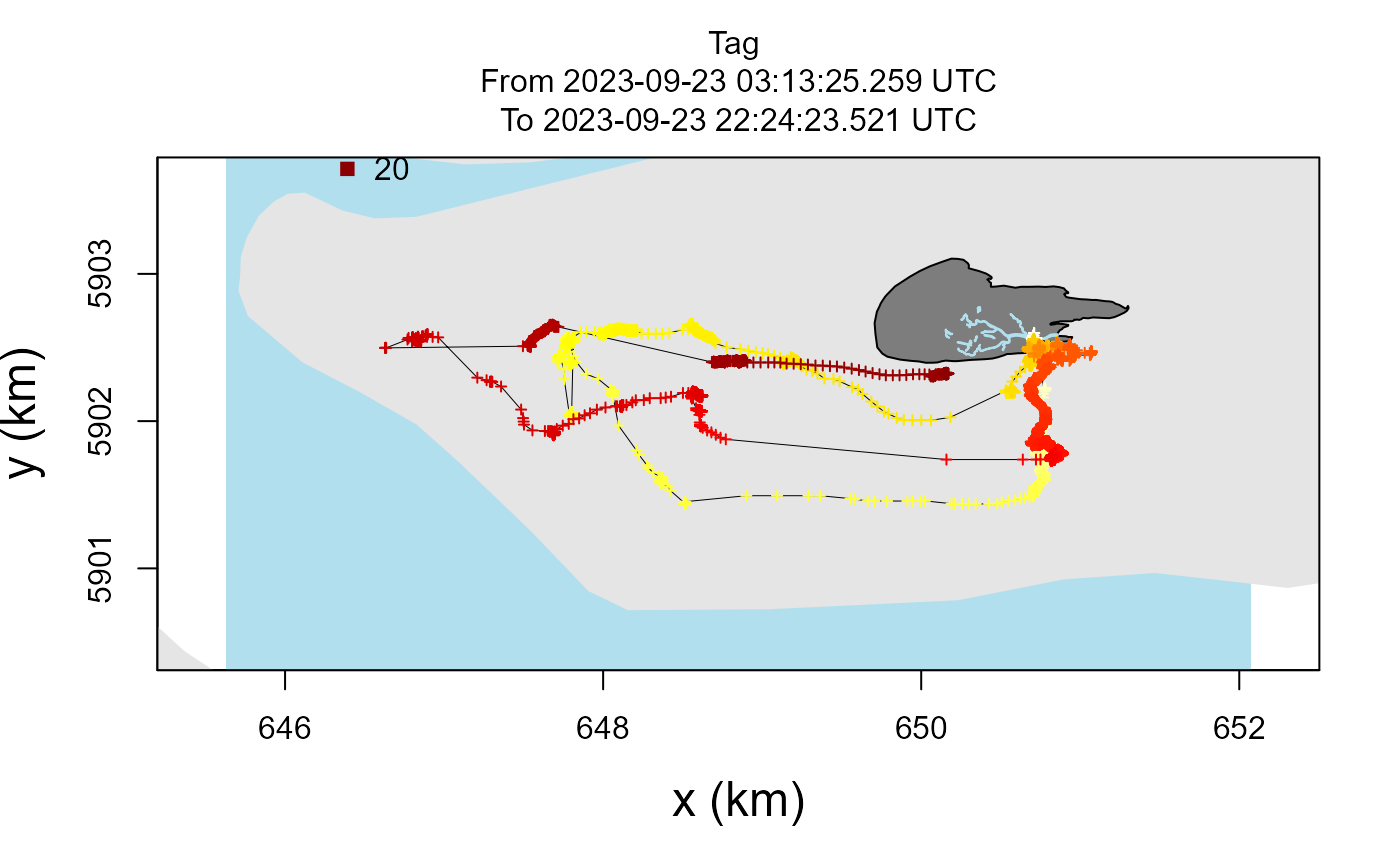
- color_by
Either
"time","sd", or"nbs", which are respectively used to colour the localization with the relative time (hours), variance in the localizations as the maximum of VARX and VARY, or the Number of Base Stations (NBS) used to calculate the localization. Defaults to "time".- towers
A dataframe with coordinates of receiver stations (named
XandY).- h
height of the plot (when saving)
- w
width of the plot (when saving)
- buffer
Buffer around bounding box in meters
- legend
Passed to the
legendfunction and sets the location of the legend in the plot.- scalebar
Length of scalebar in km.
- cex_legend
The size of the text in the legend.
- land_data
An
sfobject for land polygons. Defaults toland.- mudflats_data
An
sfobject for mudflat polygons. Defaults tomudflats.- lakes_data
An
sfobject for lake polygons. Defaults tolakes.
Examples
library(tools4watlas)
# Load example data
data <- data_example
# Transform to sf
d_sf <- atl_as_sf(data, additional_cols = names(data))
# Plot the tracking data with a simple background
atl_plot_tag(
data = d_sf, tag = NULL, fullname = NULL, buffer = 1,
color_by = "time"
)
#> [1] "Ensure that data has the UTM 31N coordinate reference system."
 atl_plot_tag(
data = d_sf, tag = NULL, fullname = NULL, buffer = 1,
color_by = "sd"
)
#> [1] "Ensure that data has the UTM 31N coordinate reference system."
atl_plot_tag(
data = d_sf, tag = NULL, fullname = NULL, buffer = 1,
color_by = "sd"
)
#> [1] "Ensure that data has the UTM 31N coordinate reference system."
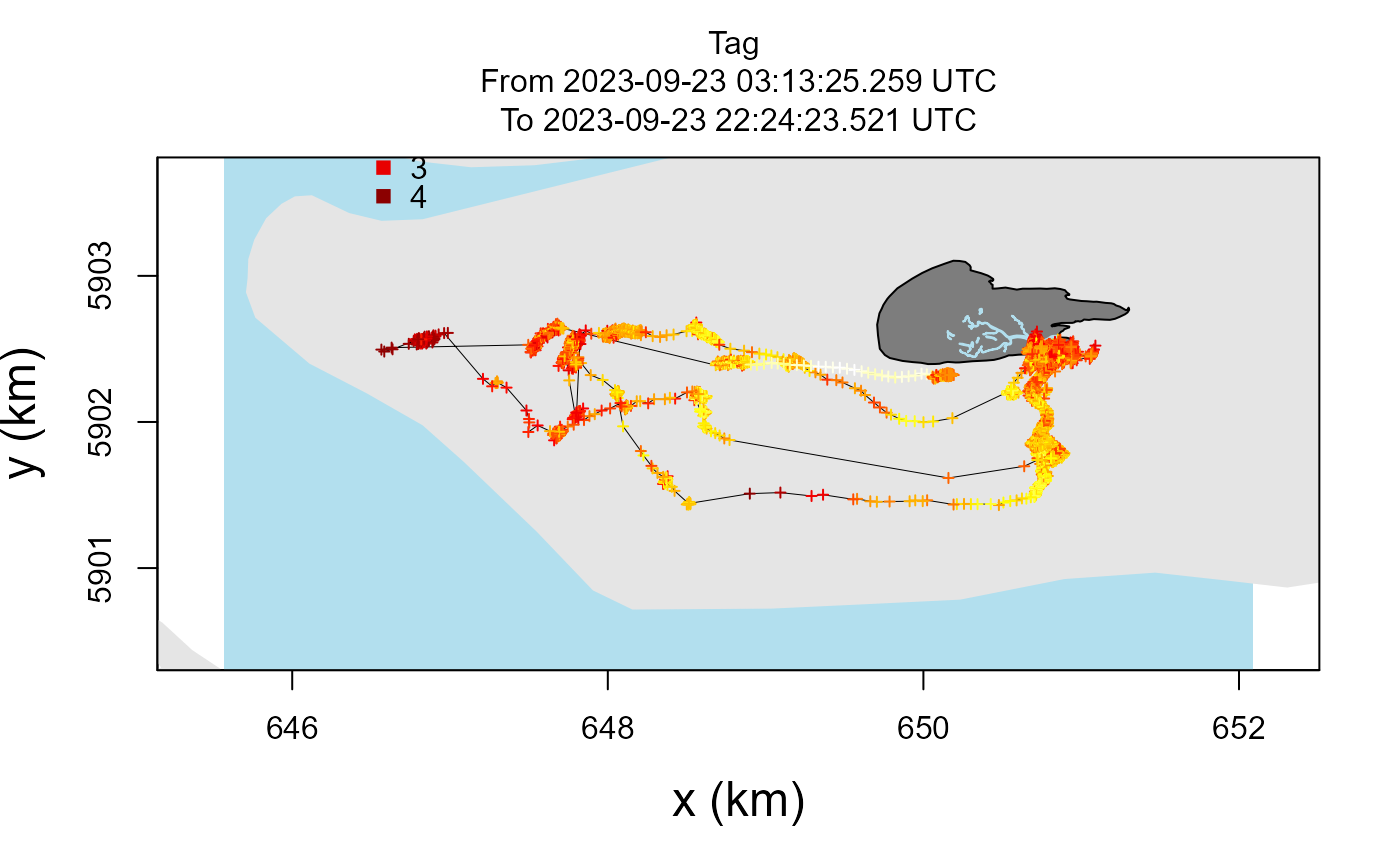 atl_plot_tag(
data = data, tag = NULL, fullname = NULL, buffer = 1,
color_by = "time"
)
#> [1] "Ensure that data has the UTM 31N coordinate reference system."
atl_plot_tag(
data = data, tag = NULL, fullname = NULL, buffer = 1,
color_by = "time"
)
#> [1] "Ensure that data has the UTM 31N coordinate reference system."