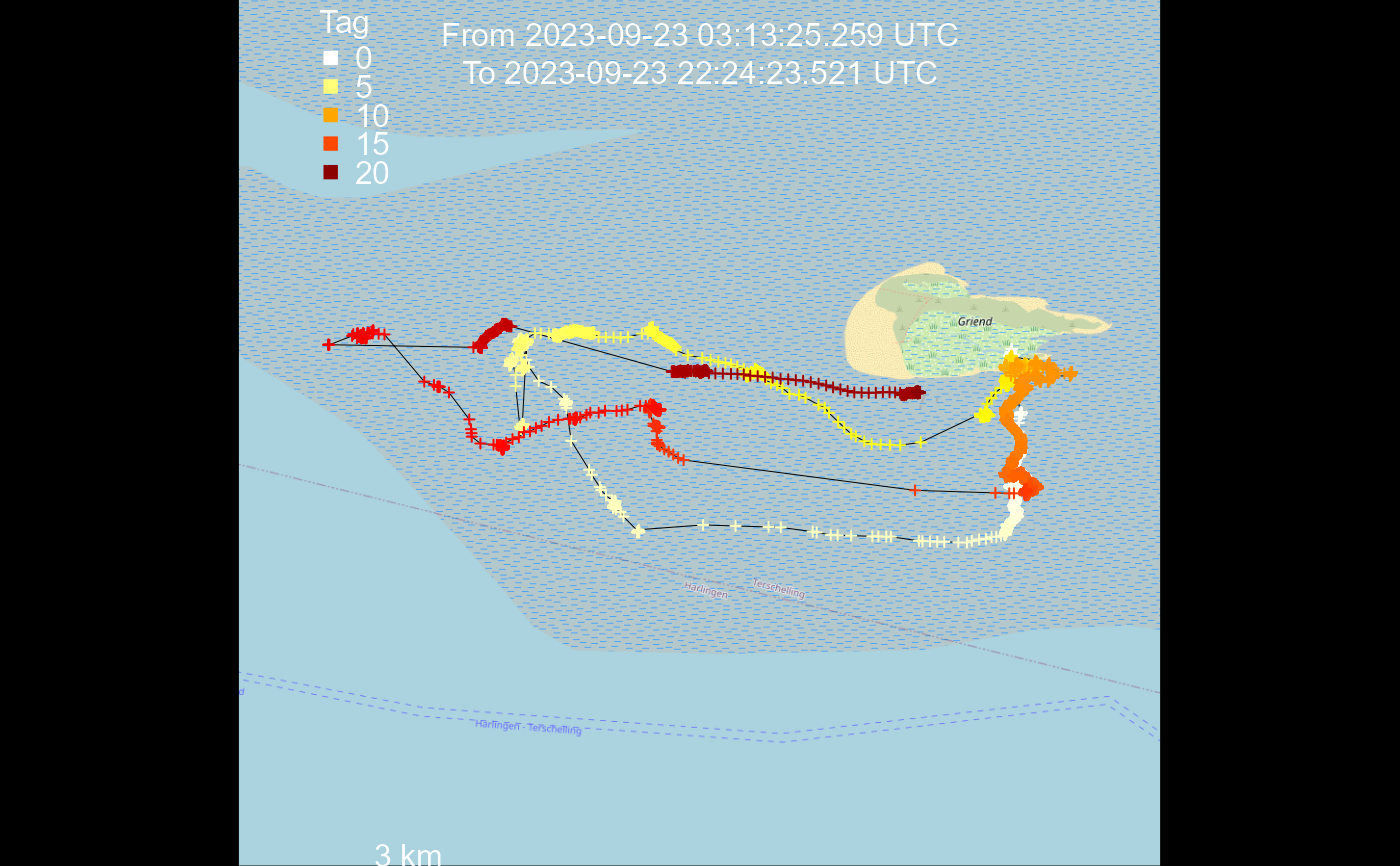
Plot track for one individual on a OpenStreetMap satellite map
Source:R/fun_plot_tag_osm.r
atl_plot_tag_osm.RdA function that plots the localization data of one individual.
Usage
atl_plot_tag_osm(
  data,
  tag = NULL,
  mapID,
  color_by = "time",
  fullname = NULL,
  ppi = 96,
  towers = NULL,
  legend = "topleft",
  scalebar = 5,
  cex_legend = 1
)
Arguments
- data
A dataframe with the tracking data. Can include multiple tags, but one tag is selected for plotting.
- tag
The four-digit tag number as character to plot. Defaults to plotting the first tag in
data.- mapID
An map-object generated with the function
OpenStreetMap::openmap().- color_by
Either
"time","SD", or"NBS", which are respectively used to colour the localization with the relative time (hours), variance in the localizations as the maximum of VARX and VARY, or the Number of Base Stations (NBS) used to calculate the localization. Defaults to "time".- fullname
If specified the plot will be saved in this path with this name (include extension). Defaults to NULL and plotting in a graphics window.
- ppi
The pixels per inch, which is used to calculate the dimensions of the plotting region from
mapID. Deafults to 96.- towers
A dataframe with coordinates of receiver stations (named
XandY).- legend
Passed to the
legendfunction and sets the location of the legend in the plot.- scalebar
Length of scalebar in km.
- cex_legend
The size of the text in the legend.
Examples
library(tools4watlas)
library(OpenStreetMap)
library(sf)

# Load example data
data <- data_example[tag == data_example[1, tag]]

# make data spatial and transform projection to WGS 84 (used in osm)
d_sf <- atl_as_sf(data, additional_cols = names(data))
d_sf <- st_transform(d_sf, crs = st_crs(4326))

# get bounding box
bbox <- atl_bbox(d_sf, buffer = 500)

# extract openstreetmap
# other 'type' options are "osm", "maptoolkit-topo", "bing", "stamen-toner",
# "stamen-watercolor", "esri", "esri-topo", "nps", "apple-iphoto",
"skobbler";
#> [1] "skobbler"
map <- openmap(c(bbox["ymax"], bbox["xmin"]),
  c(bbox["ymin"], bbox["xmax"]),
  type = "osm", mergeTiles = TRUE
)

# Plot the tracking data on the satellite image
atl_plot_tag_osm(
  data = d_sf, tag = NULL, mapID = map,
  color_by = "time", fullname = NULL, scalebar = 3
)